
 GROWTH GUIDE
Audit First Playbook: Google Business Profile Insights Action Steps
Google Business Profile insights show how people find and interact with your business on Search and Maps. They track discovery patterns (how customers found you) and direct actions (calls, website clicks, direction requests, bookings). The single best use of this data is simple: pick the action metric tied to revenue, calls or bookings usually, and treat every profile change as a test to move that one number.
TL;DR:
- Call clicks and direction requests are the most actionable metrics linked directly to revenue and should be prioritized for tracking and improvement.
- Insights count unique-per-user-per-day interactions, so spikes in activity reflect directional trends rather than exact customer counts.
- Metrics like bookings or menu views may not display for all profiles due to feature restrictions, making cross-location comparisons unreliable if data is missing.
- Exporting data via CSV, linking to Google Analytics, or using Google’s API provides scalable options for managing multiple locations and long-term trend analysis.
- Regular monitoring on a weekly basis, with in-depth analysis monthly, helps prevent reacting to normal fluctuations while maintaining steady profile optimization.
Table of Contents
- Where to Find Google Business Profile Insights
- What the Metrics Actually Measure
- How to Read Trends Without Fooling Yourself
- Exporting Data and Connecting to Analytics
- Turning Signals Into Concrete Profile Changes
- How Often Does Insights Data Update?
- Privacy and Data Aggregation in Business Profile Insights
- Can You Segment Insights by Device or Demographics?
- A Realistic Monitoring Rhythm
- How Service Grower Handles Google Business Profile Management
- Sources
- FAQ
Where to Find Google Business Profile Insights
You can pull up insights three ways, and each fits a different job.
- Search directly: type your business name into Google, open your Business Profile panel, and tap the performance section that shows recent views and actions.
- Google Maps: open your listing, tap your business name, then look for the same performance summary under your profile details.
- Business Profile manager at business.google.com: this gives you the full dashboard, with date range filters, trend charts, and metric breakdowns by category.
Single-location owners will mostly live in option three. If you manage multiple locations, the manager account lets you switch between properties or bulk-download data across the whole portfolio, which matters if you’re running five clinics or a dozen HVAC service areas. Date range filters typically default to the last seven, thirty, or ninety days, and you can adjust the start and end dates to line up with a promotion, a review push, or a season. Quick filters let you jump straight to a metric category (calls, direction requests, website clicks) instead of scrolling the full dashboard.
What the Metrics Actually Measure
Business Profile insights break down into two families: how people found you, and what they did next.
- Views: how many times your profile, photos, or posts appeared on Search or Maps.
- Searches: split into direct (someone searched your business name) and discovery (someone searched a category or product and your profile came up).
- Website clicks: taps on your website link from the profile.
- Call clicks: taps on the phone number shown in your listing.
- Direction requests: how many people asked Maps to route them to you.
- Messages and bookings: interactions through Google’s messaging feature or a connected booking link.
- Menu and product views: available mainly to restaurants and retail-type profiles, not every business category.
Google’s own Business Profile Help documentation notes that performance data comes from public, location-based signals, and not every metric shows up for every profile. A service-area plumber won’t see menu clicks; a restaurant might not see booking data unless it’s linked to a reservation partner.
Counting rules matter more than most owners realize. Google’s developer reference for daily metrics treats impressions as unique per user per day, not a raw hit counter. That means if the same person views your listing five times in an afternoon, insights count that as one impression for that day, not five.
Statistic Callout: There’s no universal benchmark number here worth quoting, because Google doesn’t publish an industry-wide average for any of these metrics. What the developer documentation does confirm is the counting method itself: unique-per-user-per-day, tracked separately across mobile, desktop, Search, and Maps surfaces. That distinction changes how you should read a spike.
How to Read Trends Without Fooling Yourself
The most common mistake owners make is treating a missing metric as a sign of zero demand. It usually isn’t. Google’s own guidance on performance and insights makes clear that some metrics simply don’t apply to certain business categories or aren’t available for every profile, so a blank booking chart might mean the feature isn’t connected, not that nobody wants to book.
When comparing two locations, only stack up metrics that both actually report. If one location shows menu views and the other doesn’t offer that feature, the comparison is meaningless on that line.
Remember the unique-per-day counting rule from the section above: a jump in call clicks from 10 to 40 in one day is a real signal, but it’s not automatically 40 different customers if someone tapped call multiple times across different sessions. Treat metric spikes as directional, not as a customer headcount.
There’s no such rule in any Google Help documentation. It’s an industry heuristic people repeat because it sounds precise, not because Google has ever confirmed it.
Pro Tip: Before declaring a win on any metric, cross-check it against something you control. If call clicks rose 30%, pull your actual phone log or CRM records for the same period. Insights measure profile behavior, not confirmed conversions.
Exporting Data and Connecting to Analytics
Insights inside the Business Profile manager work fine for a quick weekly glance, but they don’t scale well past a handful of locations. Here’s how to go further.
- Download the CSV: the manager dashboard lets you export raw numbers for a chosen date range, which you can drop into a spreadsheet to compare multiple locations side by side.
- Link to Google Analytics: this pulls GBP metrics into a dedicated collection inside your Analytics property. The tradeoff is real: Analytics only retains six months of GBP metrics, and if you link several profiles, the data aggregates rather than staying segmented by individual location.
- Use the API for programmatic access: Google’s
reportInsightsand time-series endpoints let developers pull metric history by date range and even break results down by sub-entity, like a specific menu item or product listing. - Export to BigQuery when you need custom joins or high-volume analysis that standard Analytics reporting can’t handle, especially useful for franchise groups running dozens of profiles.
Pick the dashboard route if you manage one to three locations and just need monthly trend checks. Reach for the API or BigQuery once you’re managing enough locations that manual downloads eat a full afternoon.
Turning Signals Into Concrete Profile Changes
Every metric points to a specific fix. Matching the signal to the action is where most of the value in insights actually lives.
- If views and searches are climbing but calls and clicks are flat, your discovery is working and your conversion isn’t. Update photos, add a clearer call-to-action, and confirm your booking or ordering link actually works.
- If call clicks or messages are rising, route them into a CRM or booking tool immediately and respond faster. Add call-handling notes and confirm your listed hours match reality.
- If a specific search query is driving bookings (visible in the discovery search breakdown), create a Google Post or offer built around that exact phrase.
- Run simple one-variable experiments: change a single element, like your primary photo or your booking link placement, and measure the same metric over a comparable weekday range rather than a single date.
Pro Tip: Give every experiment at least two full weeks before judging it. Weekday traffic patterns swing enough that a Tuesday-to-Tuesday comparison beats any three-day snapshot.
For businesses seeing low call volume specifically, a diagnostic checklist for profiles not getting calls walks through the most common culprits.
How Often Does Insights Data Update?
Business Profile insights don’t refresh in real time. Most metrics update on a rolling basis, typically showing a lag of a day or two before new activity appears in your dashboard, and Google has been known to hold back the most recent day or two of data entirely while it finalizes counts.
That lag catches owners off guard during a promotion. If you run a weekend sale and check insights Monday morning expecting a spike, you might see almost nothing, not because the promotion failed, but because Tuesday or Wednesday’s data hasn’t fully populated yet. The safest habit is to wait at least 72 hours after any campaign before drawing conclusions from the numbers.
Longer date ranges (30 or 90 days) tend to be more stable and less prone to this lag effect than single-day views, since a short delay on the most recent day barely moves a three-month average. If you’re building a weekly or monthly reporting habit, pull your numbers a few days after the period closes rather than exactly on the cutoff date, and you’ll avoid mistaking a data lag for a real drop in performance.
Privacy and Data Aggregation in Business Profile Insights
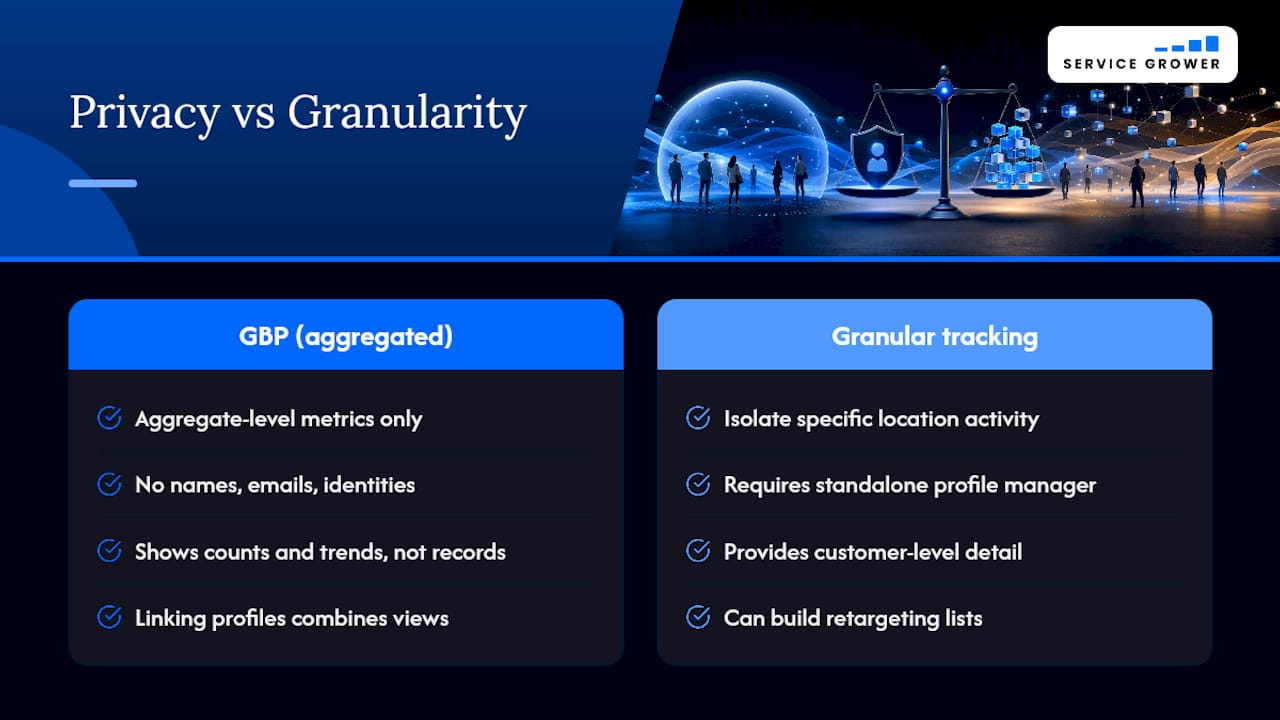
Google Business Profile insights work at an aggregate level by design. You’ll never see the name, email, or identity of the person who called your business or requested directions. The dashboard shows counts and trends, not individual customer records, which protects searcher privacy but also limits how personal your analysis can get.
This aggregation shows up most clearly when you link multiple profiles to Google Analytics. Once you connect more than one location, GBP metrics combine into a single aggregated view rather than staying broken out by individual profile. You get a clean top-line number for your whole business, but you lose the ability to isolate which specific location drove a spike without going back into the standalone Business Profile manager for that one property.
There’s a practical upside to this privacy design: you don’t have to worry about compliance headaches around storing customer-identifiable search behavior, because Google never hands you that data in the first place. What you’re managing is behavioral counts, not personal records, which keeps the reporting side simpler even if it means you can’t build a customer-level retargeting list from insights alone. If you need that kind of granular tracking, that’s a job for call tracking software or your own CRM, layered on top of what the profile dashboard gives you.
Can You Segment Insights by Device or Demographics?
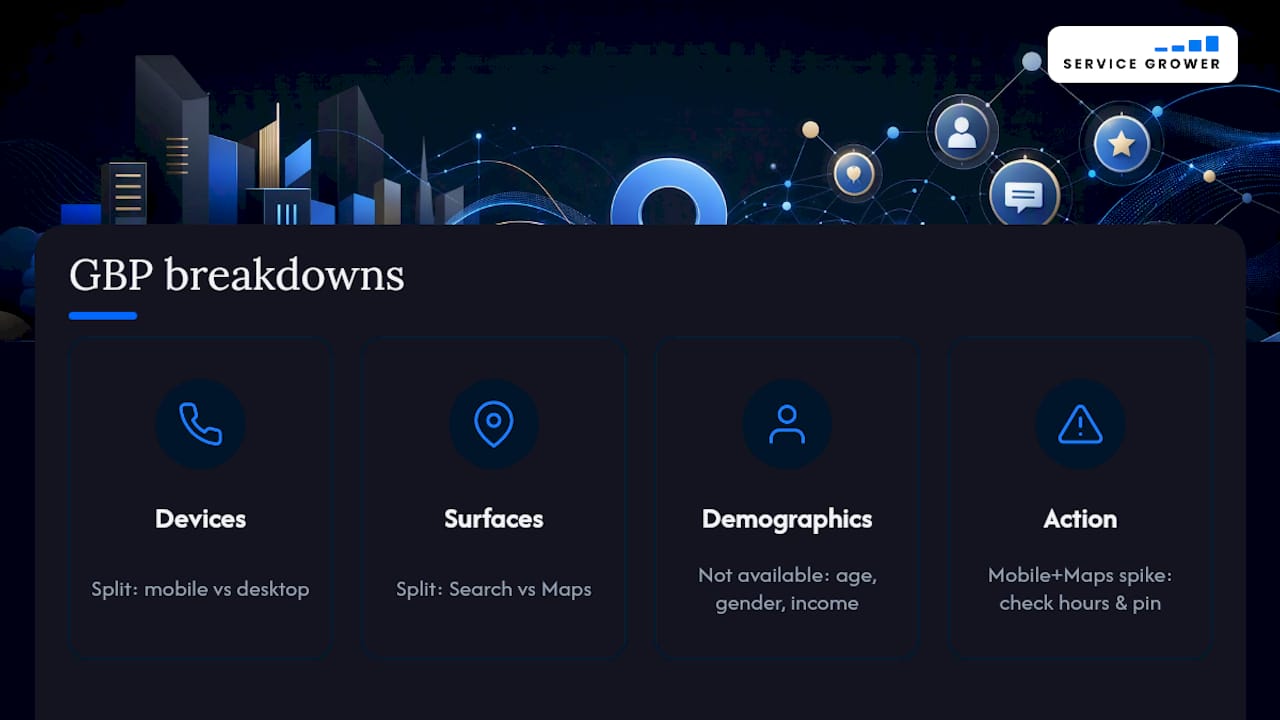
Not by demographics. Google Business Profile insights don’t expose age, gender, or income-level breakdowns for the people interacting with your listing, unlike a paid ad platform’s audience reporting.
Device and surface breakdowns are a different story. The developer metric reference confirms that data is tracked separately by device type (mobile versus desktop) and by surface (Search versus Maps). That distinction is genuinely useful: if you see a spike in direction requests coming almost entirely from mobile Maps traffic, that’s a strong signal your customers are searching on the go, right before making a purchase decision, which should shape how urgently you keep your hours and location pin accurate.
If you want anything closer to demographic segmentation, you’ll need to look outside the native dashboard. Linking to Google Analytics won’t add demographic data to your GBP metrics specifically, since that connection just aggregates the same counts into a different interface. Your best option is pairing insights with a call-tracking service that captures caller area codes, or a booking tool that collects basic customer profile data at the point of conversion. Treat native insights as your discovery and action layer, and treat any customer-level demographic work as a separate tool sitting on top of it.
A Realistic Monitoring Rhythm
Check insights weekly, just enough to catch a sudden drop in calls or a spike worth investigating, and save the real analysis for a monthly audit where you actually compare trends and decide what to change. Trying to react daily to normal noise wastes more time than it saves.
Consolidating photo updates, new posts, and review replies into that same monthly session matters more than people expect. Scattered, reactive updates rarely move the needle the way a planned monthly pass does, because each change gets tested against the same baseline instead of competing with five other variables you changed at random.
— Service Grower
How Service Grower Handles Google Business Profile Management
Some services combine dashboard, call-tracking tools, and review management into a single system that handles profile optimization, review responses, booking links, and analytics reporting.
That matters because most owners don’t have a spare afternoon each week to cross-reference call logs against insights spikes and then manually update photos and posts. Service Grower’s Google Business Profile management service folds profile upkeep, review monitoring, and performance dashboards into one place, so the diagnostic work in this guide, matching metric signals to concrete fixes, happens on a managed cadence instead of whenever you find time.
If you want a starting point before committing to anything, request the free Google Business Profile Check to see where your listing stands today. From there, the Service Grower plan covers ongoing optimization and monitoring, so the audit turns into an actual plan instead of another report that sits unread.
Sources
- Understand your Business Profile performance & insights - Google Business Profile Help
- DailyMetric | Google Business Profile APIs | Google for Developers
FAQ
What Is Google’s 20% Rule for Business Profiles?
There’s no official 20% rule published anywhere in Google’s Help documentation. It’s a heuristic that circulates in local SEO discussions without any confirmed source, so treat percentage-based ranking claims like this with skepticism and test changes on your own profile instead.
How Do I Access Google Business Profile Insights?
Open your listing directly through a Google Search or Maps result and look for the performance summary, or go to business.google.com for the full dashboard with date filters and export options. Multi-location managers can switch between properties or download data in bulk from the same manager account.
What Are the Main Categories of Metrics in Insights?
Insights group into discovery metrics (views and searches, split between direct and discovery searches) and action metrics (calls, website clicks, direction requests, messages, and bookings). Not every category appears for every business, since Google’s documentation confirms availability depends on business type and category.
Is Google Analytics Still Free to Use?
Yes, Google Analytics remains free for standard use, including linking it to your Business Profile for aggregated reporting. Keep in mind that linked GBP metrics only retain six months of history inside Analytics, so long-term trend tracking still needs the native Business Profile dashboard or a CSV export.
Can Service Grower Help Interpret My Insights Data?
Yes. Service Grower’s managed profile service turns raw metrics into scheduled optimization work, covering photos, posts, review replies, and booking links, rather than leaving you to interpret the dashboard alone. Current pricing and plan details are listed on the Service Grower pricing page.