
 GROWTH GUIDE
Call Tracking Metrics: What Marketers and Ops Teams Should Track
The metrics that actually move the needle are qualified call rate, call source/attribution, cost per qualified call, call-to-conversion rate, answer rate, and average call duration. If you only track raw call volume, you are optimizing a vanity number.

Role matters here. Marketers should start with call source, cost per qualified call, and calls by keyword — these feed directly into Google Ads bid decisions and channel budget allocation. Contact-center managers need answer rate, average handle time (AHT), and first-call resolution (FCR) first, since those three expose staffing gaps and service quality fast. Sales leaders should lock onto qualified call rate and call-to-conversion rate, because those two connect phone activity to closed revenue.
A few grounding points before you build anything:
- Google Ads lets you set a minimum call duration (commonly 30 seconds) to count a call as a conversion, which immediately filters out misdials and hang-ups from your performance data.
- CRM integration is the step most teams skip. Without it, you know a call happened but not whether it became a booking or a sale.
- Service Grower’s GrowthView reporting and lead tracking portal bring call attribution, CRM mapping, and campaign analytics into one dashboard, so you are not stitching together three separate tools.
Set a minimum qualified-call duration of 90 seconds or use an AI lead score threshold as your first operational rule. That one decision separates signal from noise before you spend another dollar on ads.
Table of Contents
- What call tracking metrics actually measure
- The essential call tracking metrics: definitions, formulas, and how to measure each
- Why these metrics matter for marketing ROI and operational performance
- How to implement call tracking: a step-by-step checklist
- How to measure, report, and benchmark your call data
- Operational use cases: staffing, QA, lead scoring, and coaching
- U.S. privacy, call recording, and consent best practices
- How AI conversation analytics changes what you track
- Common pitfalls when interpreting call tracking data
- How to segment and analyze call tracking metrics by campaign, channel, or customer segment
- Key Takeaways
- The metric most teams get wrong
- Service Grower brings call tracking and attribution together for local businesses
- Useful sources for implementation and compliance
What call tracking metrics actually measure
Call tracking metrics are quantitative measures that attribute, qualify, and evaluate phone call interactions tied to marketing and operations outcomes. They answer three questions: where did this caller come from, was the call worth anything, and what happened next?
The scope of this guide covers four categories:
- Marketing attribution: which channel, campaign, or keyword drove the call
- Quality and qualification: call duration, AI lead score, and disposition flags that separate buyers from browsers
- Operational KPIs: answer rate, AHT, FCR, and transfer rate
- Outcomes: call-to-conversion rate and revenue per call
What this guide does not cover: vendor pricing comparisons or platform-by-platform feature breakdowns. All examples assume U.S. privacy and consent norms, which vary by state (covered in the compliance section).
The essential call tracking metrics: definitions, formulas, and how to measure each
The table below gives you every core metric in one place. After the table, a worked example shows how the formulas connect in a real campaign scenario.
| Metric | Formula | Business use | Tracking method |
|---|---|---|---|
| Total call volume | Count of inbound calls in period | Baseline demand signal; staffing input | Call tracking platform, DNI |
| Call source / attribution | Calls grouped by channel, campaign, keyword | Budget allocation, channel ROI | DNI + UTM/gclid capture |
| Average call duration | Total talk time / number of calls | Proxy for lead quality | Platform reporting |
| Qualified call rate | Qualified calls / total calls × 100 | Lead quality vs. volume | Duration threshold or AI score |
| Cost per call | Total campaign spend / total calls | Efficiency benchmark | Ad platform + call platform |
| Cost per qualified call | Total campaign spend / qualified calls | True acquisition cost | Ad platform + call platform |
| Call-to-conversion rate | Conversions from calls / total calls × 100 | Revenue linkage | CRM outcome field |
| Answer rate | Answered calls / total inbound calls × 100 | Staffing and SLA health | Call platform |
| Missed call rate | Missed calls / total calls × 100 | Revenue leakage signal | Call platform |
| Average handle time (AHT) | (Talk time + hold time + wrap time) / calls | Agent efficiency, staffing | Call center platform |
| First-call resolution (FCR) | Calls resolved on first contact / total calls × 100 | Service quality, repeat-call cost | CRM disposition tag |
| Call outcome / disposition | Categorical tag (booked, quote, no-sale, etc.) | Funnel analysis, coaching | CRM call outcome field |
| Transfer rate | Transferred calls / total calls × 100 | IVR and routing quality | Call platform |
| AI conversation score | Model-assigned lead quality score (0–100) | Automated qualification at scale | AI transcription layer |
| Revenue per call | Total revenue attributed to calls / total calls | Marketing-to-revenue ROI | CRM + revenue data |
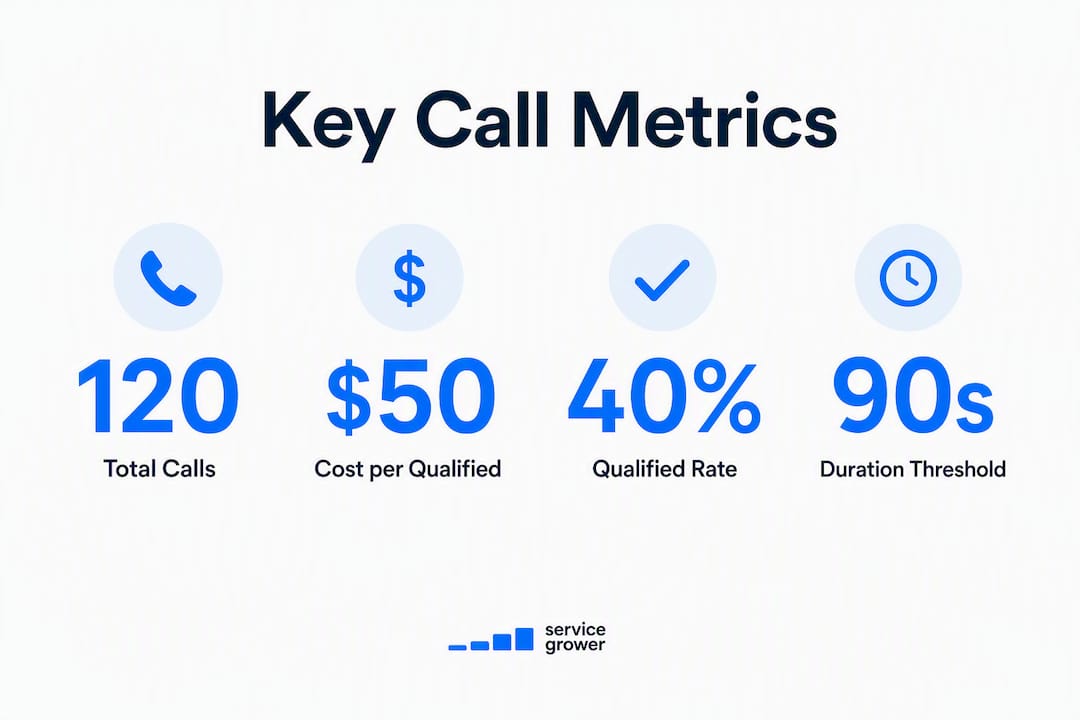
Worked example. A local HVAC company runs a Google Ads campaign. In one month: $2,400 spend, 120 inbound calls, 48 calls lasting 90+ seconds (the qualified threshold). Cost per call = $2,400 / 120 = $20. Cost per qualified call = $2,400 / 48 = $50. If 16 of those 48 qualified calls booked a job, call-to-conversion rate = 16 / 48 × 100 = 33%.
That $50 cost per qualified call is the number worth optimizing. Cutting it to $40 by pausing low-quality ad groups is a concrete, measurable win.
Pro Tip: Define “qualified” once and apply it consistently. A duration threshold of 90–120 seconds works for most service businesses. If you use AI scoring, set a minimum score (e.g., 65/100) and document it so the rule does not shift between reporting periods. Inconsistent thresholds make month-over-month comparisons meaningless.
Advanced practitioners focus on qualified-call rate rather than raw volume because high call volume with low qualification is a vanity signal. A campaign generating 200 calls at 15% qualified rate is worse than one generating 80 calls at 55% qualified rate, even though the first looks better on a volume dashboard.
Why these metrics matter for marketing ROI and operational performance
Call tracking connects the online click to the offline conversation, which means every dollar of ad spend finally has an accountable downstream outcome. Without it, a Google Ads campaign that drives 60 calls looks identical to one that drives 60 form fills, even though the call campaign might close at twice the rate.
Marketing benefits:
- Attribute calls to the exact keyword, ad group, or landing page that generated them, then shift budget toward the sources producing the lowest cost per qualified call.
- Use calls-by-keyword data to make bid adjustments in Google Ads, pausing keywords that generate high call volume but low qualification rates.
- Identify landing pages that drive calls but not conversions, and test copy or offer changes against call-to-conversion rate as the primary KPI.
Operational benefits:
- Analyzing call volume by hour and day reveals staffing gaps directly. If 40% of calls arrive between 11 AM and 1 PM and you are short-staffed then, your missed call rate will show it.
- Call scoring data pinpoints which agents need coaching and on which call types, making QA targeted rather than random.
- Call recordings with timestamps resolve billing disputes and customer complaints faster than any manual log.
Budget reallocation example. A home services company tracks calls by channel and finds that Yelp generates 30 calls per month at a cost per qualified call of $95, while organic search generates 22 calls at $28 per qualified call. Shifting $500 per month from Yelp to SEO content does not reduce total call volume much, but it drops the blended cost per qualified call significantly. That is the kind of decision call tracking makes obvious.
Pro Tip: Map each metric to a specific decision. Answer rate informs staffing. Cost per qualified call informs budget allocation. Call-to-conversion rate informs offer and script quality. Teams that track metrics without mapping them to decisions end up with dashboards nobody acts on.

How to implement call tracking: a step-by-step checklist
Implementation is more straightforward than most teams expect. Dynamic Number Insertion (DNI) requires a single JavaScript snippet that swaps the phone number displayed on your site based on the traffic source. A non-technical team member can install it in under an hour.
Step-by-step checklist:
- Define conversion thresholds. Set a minimum call duration (90–120 seconds is a reasonable starting point for most service businesses) or an AI score floor in your call platform. Google Ads supports duration-based call conversions natively.
Required integrations:
Cost and timeline:
| Factor | Typical range | Notes |
|---|---|---|
| Tracking numbers | $1–$5/number/month | Local numbers cost less than toll-free |
| Per-minute charges | — | Varies by platform and volume |
| AI transcription | — | Add-on on most platforms |
| DNI setup | One-time, low effort | Single JS snippet via GTM |
| CRM integration | 2 hours | Depends on CRM and connector availability |
Timeline:
Pro Tip: Pilot on one campaign first. Pick your highest-spend Google Ads campaign, assign a single tracking number, set your qualified-call threshold, and run for 30 days before expanding. A focused pilot surfaces data-quality issues before they contaminate your whole account.
For a deeper look at call tracking for small business implementation, including DNI setup walkthroughs and attribution rules for common channels, that guide covers the technical checkpoints in detail.
How to measure, report, and benchmark your call data
A useful call tracking dashboard has three panels: a top-line KPI summary, a source-level breakdown, and an operational panel. You do not need a custom BI tool. Google Looker Studio connected to your call platform’s API handles this for most teams.
Sample dashboard layout:
- Top-line KPIs: total calls, qualified call rate, cost per qualified call, call-to-conversion rate, answer rate
- Source breakdown: calls and qualified calls by channel, campaign, and keyword; cost per qualified call by source
- Trend charts: qualified call rate and cost per qualified call over 13 weeks
- Operational panel: answer rate, missed call rate, AHT, FCR by agent or team
Key formulas (quick reference):
| Ratio | Formula |
|---|---|
| Qualified call rate | Qualified calls / total calls × 100 |
| Cost per qualified call | Campaign spend / qualified calls |
| Call-to-conversion rate | CRM-confirmed conversions / total calls × 100 |
| Answer rate | Answered calls / total inbound × 100 |
| FCR rate | First-contact resolutions / total calls × 100 |
Reporting cadence:
- Daily: answer rate and missed calls (operational SLA monitoring)
- Weekly: call volume by campaign, cost per call, qualified call rate by source
- Monthly: call-to-conversion rate, revenue per call, FCR trend, AHT by agent
- Quarterly: full funnel review — from impression to closed revenue, with call data as the middle layer
Benchmarks to set internally. Industry benchmarks vary too much by vertical to apply universally, but a few directional targets are widely used: answer rate of 80% or higher is a common SLA target for service businesses; qualified call rates below 30% often signal a targeting or landing-page problem rather than a call-handling issue. Build your own baseline from the first 60 days of data, then set improvement targets against that baseline rather than against a generic industry number.
For low-volume campaigns (fewer than 30 calls per month per channel), treat the data as directional rather than statistically conclusive. Pool two or three months before making budget decisions.
Operational use cases: staffing, QA, lead scoring, and coaching
Call data is most powerful when it drives a specific operational decision, not when it sits in a report.
Use cases by function:
- Staffing: Pull calls by hour and day of week. If Tuesday mornings and Friday afternoons are your peak windows, schedule your best agents there. Missed call rate drops almost immediately when staffing matches demand.
- Answer rate SLAs: Set an 80% answer rate target and review it weekly. When it dips, the cause is usually one of three things: a volume spike, an understaffed shift, or a routing misconfiguration.
- IVR and routing optimization: A transfer rate above 25–30% usually means your IVR menu does not match how callers describe their needs. Pull the most common transfer paths and simplify the menu.
- Lead scoring: Use AI call scores to prioritize callbacks. Calls scoring above your threshold get a same-day callback; lower-scored calls go into a standard queue.
Three-step coaching playbook:
- Identify the problem campaign. Pull qualified call rate by campaign. Find the one with the lowest rate despite reasonable volume.
- Sample calls with low AI scores. Listen to 10–15 calls from that campaign. Look for two or three repeatable patterns: a common objection the agent is not handling, a pricing question that derails the call, or a script gap at the close.
- Coach on two specific changes, then measure. Give agents two concrete script adjustments. Track qualified call rate and call-to-conversion rate for that campaign over the next 30 days. A 5–10 percentage point improvement is a realistic target from a single coaching cycle.
Cross-functional alignment. Marketing and ops need to agree on the qualified-call definition before either team reports on it. If marketing counts any call over 60 seconds as qualified and ops counts only calls with a “booked” disposition tag, the two teams will report different numbers from the same data. Document the rule, put it in the CRM, and review it quarterly.
U.S. privacy, call recording, and consent best practices
Call recording and caller-data capture are legal in the United States, but state laws differ significantly on consent requirements. Federal law (the Electronic Communications Privacy Act) requires one-party consent, meaning only one person on the call needs to know it is being recorded. However, a number of states, including California, Florida, Illinois, and Washington, require all-party (two-party) consent. If your business operates in or receives calls from those states, you need explicit consent from the caller.
Operational best practices:
- Play an on-call consent prompt (“This call may be recorded for quality and training purposes”) at the start of every inbound call, regardless of state. It satisfies two-party requirements and documents consent automatically.
- Build opt-out language into your IVR for callers who do not consent to recording.
- Use selective redaction for sensitive data: payment card numbers, Social Security numbers, and health information should be masked in transcripts and recordings.
- Set a data retention policy. Most businesses do not need recordings older than 12–24 months. Shorter retention reduces liability exposure.
- Log consent in your CRM with a timestamp so you have an admissible audit trail if a dispute arises.
Pro Tip: Use role-based access controls so only QA managers and legal staff can access full recordings. Agents reviewing their own calls for coaching purposes can work from AI-generated transcripts with sensitive data redacted. This protects caller privacy without losing the coaching value of the recording.
This section provides general operational guidance, not legal advice. Confirm your recording and data practices with a qualified attorney familiar with the laws of each state where you receive calls.
How AI conversation analytics changes what you track
AI-driven conversation analytics shifts the measurement focus from volume to lead-quality signals. Instead of counting calls, you are capturing intent, sentiment, and qualification signals automatically, at a scale no human QA team can match.
AI-powered call analysis transcribes, summarizes, and assigns a lead score to every call. That means a team handling 500 calls per month can score all 500 rather than manually sampling 50.
Signals worth capturing with AI:
- Intent keywords: phrases like “how soon can you come out,” “what does it cost,” or “do you have availability” that correlate with high purchase intent
- Sentiment polarity: caller sentiment at the start, middle, and end of the call, which often predicts whether the call will convert
- Talk-to-listen ratio: agents who dominate the conversation (above 60–65% talk time) tend to close at lower rates; AI surfaces this without manual review
- AI lead score threshold: a score above your defined floor (e.g., 65/100) triggers automatic “qualified” tagging in your CRM
Implementation notes:
| Step | What to do | Why it matters |
|---|---|---|
| Pilot with a sample | Run AI scoring on one campaign for 30 days | Validates model accuracy before full deployment |
| Human audit sample | Manually review 10–20% of AI-scored calls | Catches model errors and drift early |
| Monitor for drift | Re-validate scoring quarterly | Call patterns and language shift; models need recalibration |
| Document thresholds | Record the score floor and qualification rules | Prevents silent rule changes that corrupt trend data |
Pro Tip: Start in hybrid mode: deploy AI scoring but keep a human audit on 10–20% of calls for the first 60 days. This is the approach practitioners recommend for validating model accuracy before trusting automated disposition for conversion tracking. Once accuracy is confirmed above 85–90%, you can reduce the audit sample.
Lead generation automation frameworks that combine AI pre-scoring with human validation are directly applicable here. The same hybrid pipeline logic that works for web leads applies to call qualification.
Common pitfalls when interpreting call tracking data
Most call tracking mistakes are not technical. They are interpretive.
Treating call volume as a success metric. A campaign that drives 200 calls at 12% qualified rate is not performing well. Volume without qualification is noise. Always report qualified call rate alongside total volume.
Inconsistent qualified-call definitions. If your duration threshold changes from 60 seconds to 90 seconds between months, your qualified call rate trend is meaningless. Lock the definition in your platform settings and document it.
Ignoring the time-of-day dimension. A high answer rate averaged across the week can hide a terrible answer rate on Monday mornings. Always segment answer rate by day and hour before drawing staffing conclusions.
Attributing all calls to the last click. DNI captures the session source, but a caller who saw your TV ad, then searched your brand name, and then called will be attributed to branded search. Multi-touch attribution is hard with calls, but at minimum, track branded vs. non-branded call sources separately.
Conflating call duration with call quality. A 10-minute call is not automatically a high-quality lead. An angry customer complaint can run long. Use AI scoring or disposition tags alongside duration to qualify calls, not duration alone.
Not accounting for repeat callers. A customer who calls three times about the same issue inflates call volume and distorts AHT averages. Most call platforms can flag repeat callers by phone number. Segment repeat calls separately when reporting on new lead volume.
Skipping statistical significance checks. A campaign with 15 calls per month does not have enough data to draw conclusions about qualified call rate. Pool multiple months or expand the campaign before making budget decisions based on that data.
How to segment and analyze call tracking metrics by campaign, channel, or customer segment
Segmentation is where call tracking data becomes genuinely useful. Aggregate numbers tell you what happened. Segmented numbers tell you why.
By campaign and channel. Start here. Pull qualified call rate and cost per qualified call for every active channel: Google Ads (broken down by campaign and ad group), Facebook, organic search, direct, Yelp, and any offline sources with tracking numbers. Channels that look similar on cost-per-click often look very different on cost per qualified call. That gap is your optimization opportunity.
By keyword. For paid search, keyword-level call attribution is the most granular and most valuable segmentation available. A keyword generating calls at $15 cost per qualified call deserves more budget. One generating calls at $120 cost per qualified call needs to be paused or restructured, regardless of its click-through rate.
By landing page. Assign unique tracking numbers to each major landing page variant. A page with a 40% qualified call rate from the same traffic source as a page with 18% is telling you something about offer clarity, trust signals, or call-to-action placement.
By time of day and day of week. Segment answer rate, AHT, and qualified call rate by hour and day. You will often find that calls arriving during peak hours have lower qualified rates because agents are rushed. That is a staffing and routing problem, not a marketing problem.
By customer segment. If your CRM tags customers by type (new vs. returning, residential vs. commercial, high-value vs. standard), push those tags back to your call records. Comparing qualified call rate and call-to-conversion rate by customer segment reveals which segments are worth more per call and which campaigns are attracting the wrong audience.
By agent or team. For contact centers, segment FCR, AHT, and call-to-conversion rate by agent. This surfaces your top performers for coaching benchmarks and identifies agents who need targeted support. Avoid using this data punitively without context; a high AHT agent might be handling the most complex calls.
Key Takeaways
Qualified call rate and cost per qualified call are the two metrics that most directly connect phone call activity to marketing ROI, and they should be the first numbers any team tracks after installing DNI and setting a consistent qualification threshold.
| Point | Details |
|---|---|
| Start with three metrics | Track qualified call rate, cost per qualified call, and answer rate before adding anything else. |
| Set your qualified-call rule first | Define “qualified” by duration (90–120 seconds) or AI score and document it before collecting data. |
| CRM integration is non-negotiable | Without mapping call outcomes to CRM fields, you cannot connect calls to closed revenue. |
| Segment before you optimize | Aggregate metrics hide the channel, keyword, or time-of-day patterns that drive real decisions. |
| Service Grower’s GrowthView | Service Grower’s GrowthView reporting and lead tracking portal bring call attribution and CRM mapping into one platform for local businesses. |
The metric most teams get wrong
Most teams implement call tracking, watch their dashboard fill up with numbers, and then optimize for the wrong one. Call volume is the easiest metric to move and the least connected to revenue. It is also the one that gets reported in Monday morning meetings.
The real signal is cost per qualified call, and it almost never gets the attention it deserves. A campaign can cut cost per click by 30% while cost per qualified call rises, because the cheaper clicks are attracting lower-intent callers. That is a common outcome of broad-match keyword expansion, and call tracking is the only way to catch it before it drains the budget.
There is also a gap between what AI conversation analytics promises and what it delivers in the first 90 days. The models are genuinely useful, but they need calibration against your specific business context. An AI model trained on general call data will misclassify calls in specialized verticals, like HVAC diagnostics or legal intake, until it has seen enough of your calls to learn your language. The hybrid approach (AI scoring plus human audit) is not a compromise. It is the correct methodology for the first quarter of deployment.
The operational side of call tracking is underrated. Staffing adjustments based on call volume by hour tend to produce faster customer-satisfaction gains than any marketing optimization, simply because a missed call is a lost customer. Most businesses that implement call tracking focus entirely on the marketing attribution layer and ignore the answer rate data sitting in the same platform.
Service Grower brings call tracking and attribution together for local businesses
Local businesses that want call attribution, CRM integration, and campaign reporting without stitching together three separate tools have a direct path with Service Grower. The platform’s GrowthView analytics dashboard surfaces call performance data alongside lead tracking and campaign results, so you can see cost per qualified call and answer rate in the same view as your Google and Meta ad performance.
Service Grower’s lead tracking portal handles DNI setup, call outcome mapping, and CRM integration as part of the platform, not as add-ons that require a developer. The SmartRequest booking forms connect call outcomes to appointment data, so you can track the full path from ad click to booked job.
Relevant capabilities for teams implementing call tracking:
- DNI setup and channel attribution
- Call outcome and lead tracking portal
- GrowthView reporting with campaign-level call data
- CRM and booking integration via SmartRequest
- Optional managed Google and Meta Ads with call conversion tracking built in
Book a 15-minute call to see how Service Grower fits your current setup, or go straight to servicegrower.com/go to schedule a demo.
Useful sources for implementation and compliance
- Call tracking metrics: definitions and key measures — Clear definitions of core call tracking metrics including volume, source, duration, and conversion rate; a good starting reference for building your KPI list.
- Google Ads call conversion tracking — Google’s official guide to setting up call conversions in Google Ads, including duration thresholds and call reporting configuration.
- Call analytics guide: metrics that matter — Practitioner-focused guide on qualified call rate and how to define qualification rules for revenue-focused measurement.
- DNI and call attribution — Technical walkthrough of Dynamic Number Insertion, channel assignment, and attribution setup for small and mid-size teams.
- CRM integration for call tracking — Explains why CRM mapping is the step that connects call tracking to downstream revenue outcomes.
- Operational benefits of call tracking — Covers staffing optimization, answer rate improvement, and SLA management using call volume data.
- Pay-per-call metrics and frameworks — Useful for teams running affiliate or pay-per-call distribution models; covers concurrency, revenue per call, and lead-to-account matching.
- Call tracking for small business: stop missing revenue — Practical implementation guide covering DNI and attribution setup for small businesses; complements the implementation checklist in this article.
- Lead generation automation: a practical guide for 2026 — Covers AI-powered lead classification and hybrid scoring workflows applicable to call qualification pipelines.
- Service Grower: local business visibility and lead tracking — Service Grower’s platform overview covering GrowthView analytics, call tracking, CRM integration, and managed advertising for local businesses.